Renewable power
Saudi renewables and battery storage: complete guide
One guide across Saudi renewable power, battery storage, dedicated off-grid systems and hydrogen, with the operating assets and the pipeline stages identified on each map. It covers about 70 GW of renewable projects — 70.303 GW before rounding: the 63.813 GW KAPSARC grid register, 4.49 GW at NEOM Green Hydrogen, The Red Sea and AMAALA, and 2 GW of separately reported ENOWA tenders whose awards remain unverified — and 44.3 GWh of battery projects. Prices are capacity-weighted means over priced projects only, 1.47 US cents/kWh for solar and 1.77 for wind, which are generation benchmarks rather than the cost of electricity delivered around the clock. The public-source review is dated 11 September 2026, with capacity and cost checks on 12 September.
- Compiled 12 September 2026
- 15 pages
What the report covers
Saudi Arabia's renewable expansion is becoming a story about entire energy systems.
Solar and wind projects supply the grid. Batteries shift energy across the day. Off-grid destinations combine electricity, water and cooling. Hydrogen projects connect renewable power to industry and exports.
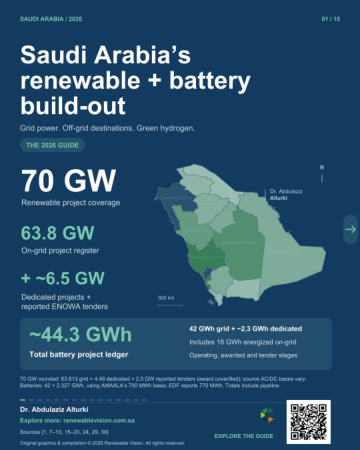
This illustrated guide covers approximately 70 GW of renewable projects and 44.3 GWh of battery projects, with operating assets and pipeline stages identified.
The renewable total starts with KAPSARC’s 63.8 GW grid register, adds 4.49 GW at NEOM Green Hydrogen, The Red Sea and AMAALA, and includes 2 GW of separately reported ENOWA tenders whose current awards remain unverified. The underlying total is 70.303 GW, rounded to 70 GW on the cover.
The battery ledger combines 42 GWh of grid projects with approximately 2.3 GWh of dedicated systems. Of the grid total, 18 GWh was energized by June 2026; the balance includes awarded and procurement-stage projects.
Inside the guide:
• Solar and wind maps with 38 reported project prices: capacity-weighted averages of 1.47 and 1.77 US cents/kWh.
• Named battery projects, their reported capacities and procurement stages.
• Saudi battery equipment/EPC auction costs, alongside a separately labeled modeled LCOS benchmark.
• Dedicated renewable systems and the two ENOWA tender records together on one map.
• Selected procurement cycles compared separately from actual renewable additions, including China.
One distinction matters throughout: a tender is not an operating plant, and a generation price is not the cost of electricity delivered around the clock.
The main public-source review is dated 11 September 2026, with targeted capacity and cost checks on 12 September. Detailed source dates, capacity definitions and links are included in the guide. The dedicated battery total uses AMAALA’s 700 MWh basis; EDF reports 770 MWh for the same asset. NGHC’s 400 MWh system rating is kept separate from its supplier’s 600 MWh DC quantity.
Which interface deserves the next closer look: storage, water, hydrogen or industrial demand?
What the figures mean
Quoted from the report's own notes on scope and definitions, in the words it published them in.
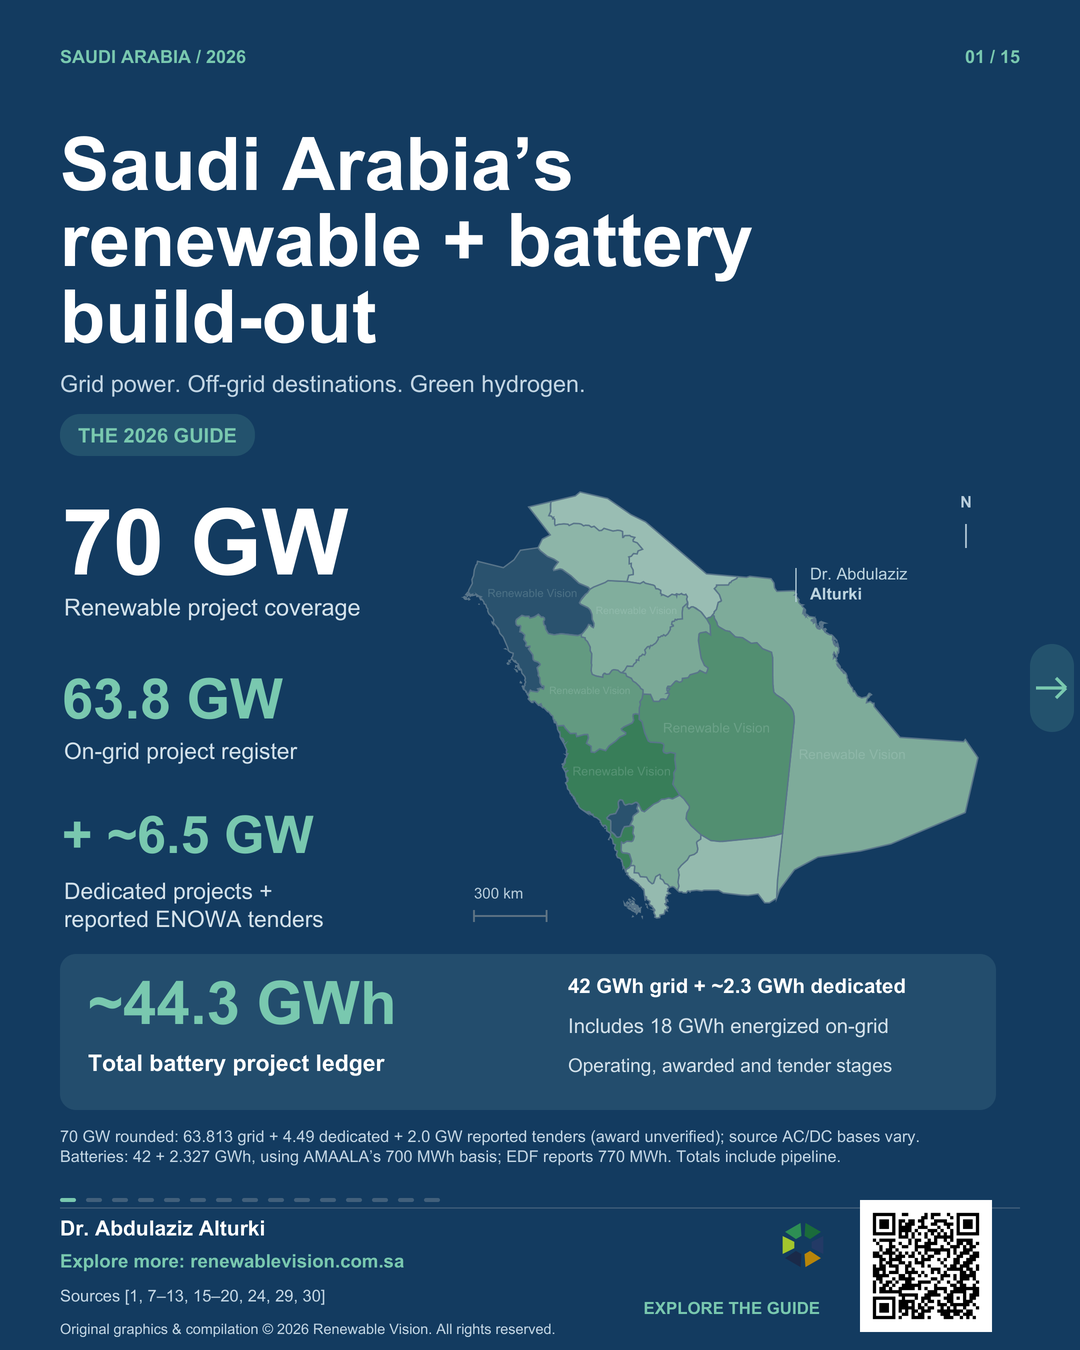
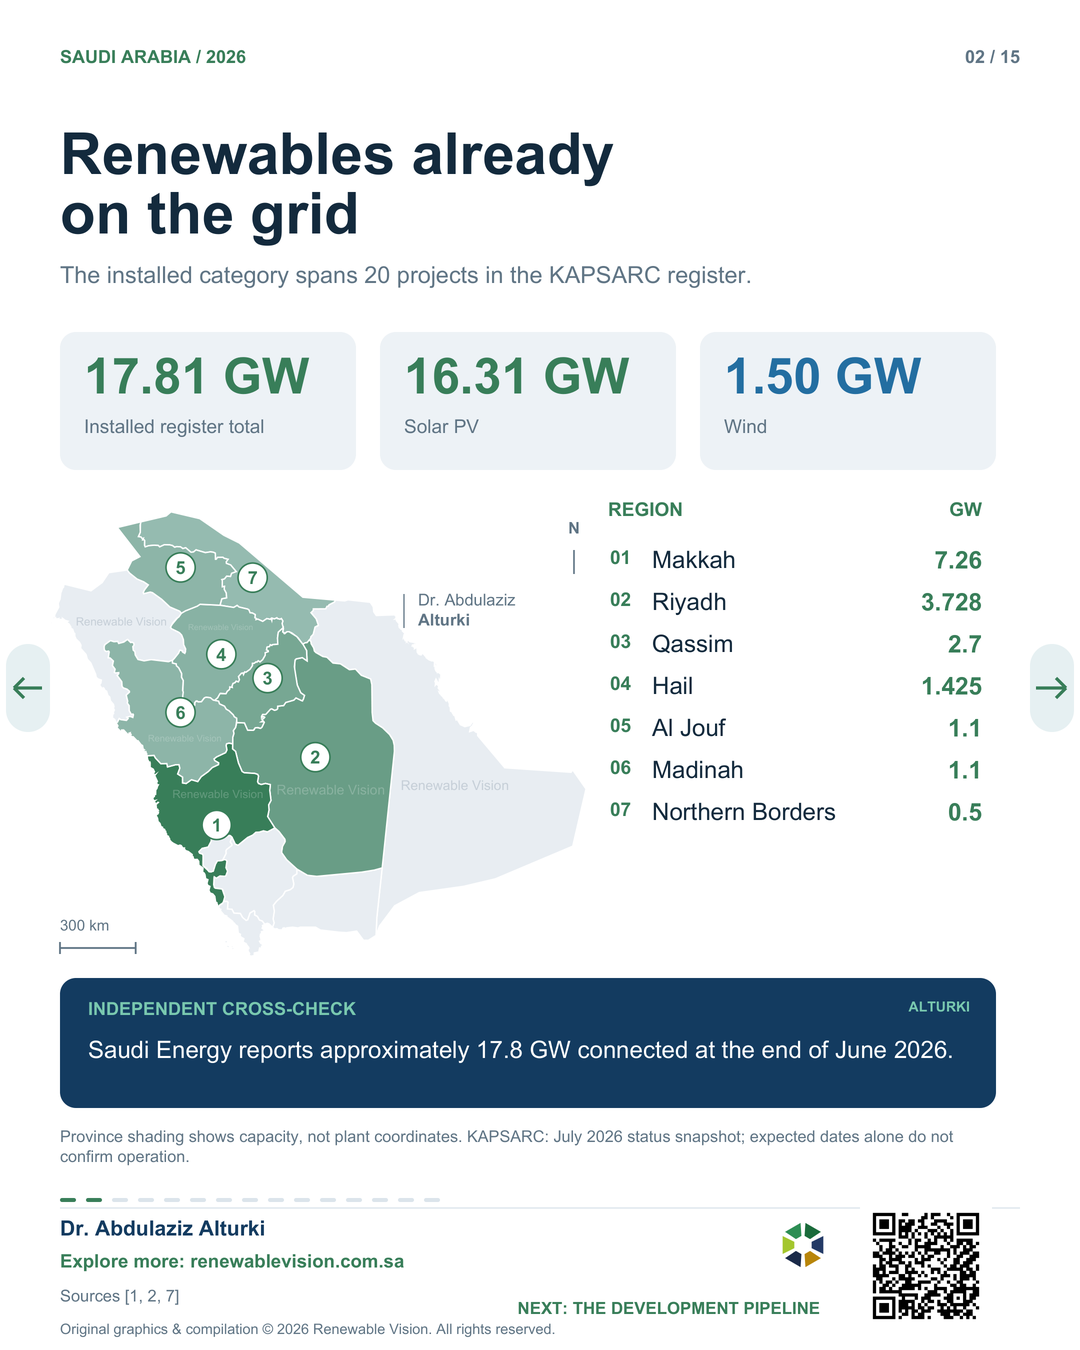
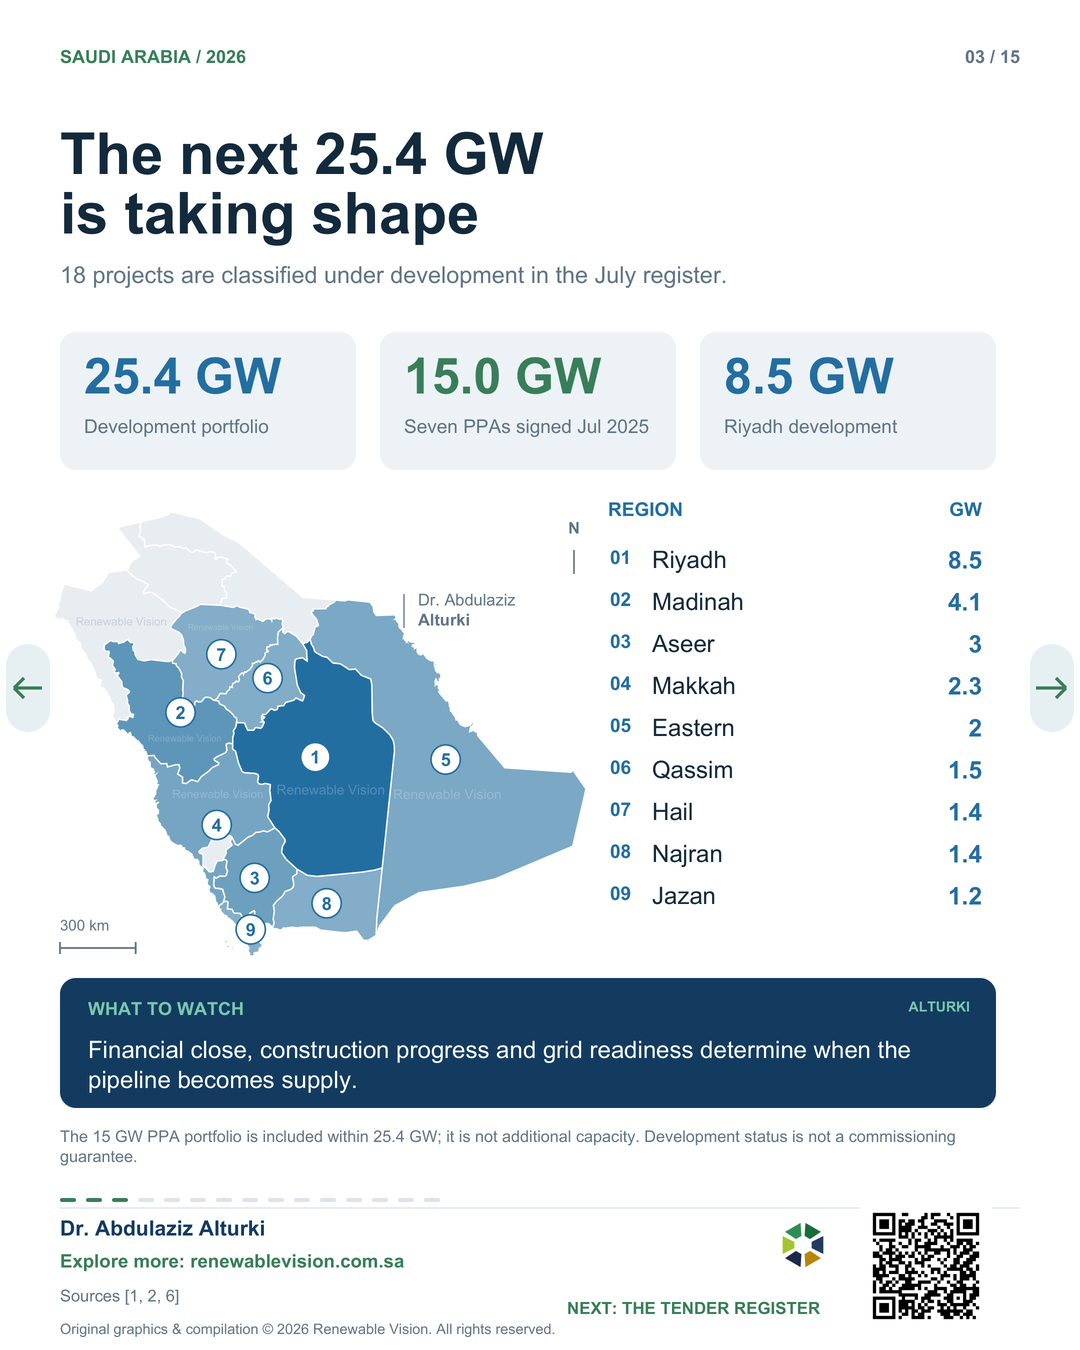
- Grid renewables: 53 KAPSARC records, 63.813 GW in the July 2026 snapshot. Installed: 17.813 GW; development: 25.4 GW; tendered: 20.6 GW. This is a project register including pipeline, not a total of operating generation. All 38 SPPC awarded project names/capacities were reconciled. SPPC status filters lag five KAPSARC records; Saudi Energy independently reports about 17.8 GW connected by June 2026.
- Renewable tenders: all 15 tendered register records are listed. The six Round 7 projects total 5.3 GW and are already included. The other nine total 15.3 GW; no unverified tender-round assignment is made. No later public SPPC renewable round than Round 7 or battery group than Group 2 was verified. This does not establish that private invitations or unindexed notices do not exist. Secondary Round 7 deadline reporting is not treated as a buyer-issued amendment.
- Price coverage and weighting: two slides display all 31 priced solar and seven priced wind projects as location points. The capacity-weighted average equals the sum of each project's capacity multiplied by its LCOE, divided by the sum of priced-project capacities. Solar: 53.70431 / 36.513 = 1.4708271027 US cents/kWh, displayed as 1.47. Wind: 11.833568 / 6.7 = 1.7662041791, displayed as 1.77. These are capacity-weighted averages, not medians. Provincial shading uses the same calculation within each province; it does not spatially interpolate tariffs. The three bands are below 1.50, 1.50 to below 2.00, and at least 2.00 US cents/kWh. Gray denotes no priced project. The calculation retains twelve full-precision SPPC awards and the unrounded KAPSARC API values for other projects; map labels are rounded only for display. Fifteen unpriced tenders are excluded from both numerator and denominator. Values are historical nominal generation benchmarks, not common-year tariffs, generation-weighted system costs or firm delivered electricity costs. One US cent/kWh equals USD 10/MWh.
- Renewable point locations: all 53 points come from the KAPSARC dashboard API checked on 11 September 2026. They are indicative project/locality positions, not surveyed plant coordinates. Number badges may be displaced with leader lines; the dots preserve the geographic anchors. Slide 4 combines the 15 tender points with province capacity shading. The 31 solar and seven wind price points appear on slides 7 and 8.
- Grid batteries: 21 distinct projects, totaling 42 GWh at cited project ratings: 18 GWh energized across nine Saudi Energy projects; 4 GWh in two further awarded SE sites, whose energization was not verified; 8 GWh under SPPC Group 1 agreements; 12 GWh in Group 2 procurement. Group 1 agreements were signed 20 August 2026; Group 2 qualifications were published 30 June 2026. Pipeline is not operating capacity.
Sources
The PDF carries its own source page as well.
- Map-data license
- KAPSARC. Renewable Energy Projects Dashboard. July 2026 project snapshot
- SPPC / Principal Buyer. Renewable project register. 38 records checked 11 Sep 2026
- SPPC / Principal Buyer. Round 7: six projects, 5,300 MW. RFQ announcement, 16 Sep 2025
- SPPC / Principal Buyer. Round 7 qualified developers. Qualification notice
- SPPC / Principal Buyer. Round 6 awards and exact LCOEs. 27 Oct 2025
- SPPC / Principal Buyer. Seven PPAs totaling 15,000 MW. 13 Jul 2025
- Saudi Energy. H1 2026 earnings release, p. 4. 18 GWh energized; 17.8 GW renewables
- Saudi Energy. H1 2025 results presentation, p. 8. Fleet locations and project ratings
Preview
3 of 15 pages shown
Get the report
Saudi renewables and battery storage: complete guide
The PDF and the data files are free for members. Membership takes a minute: verify an email address or a mobile number once, and the download opens along with the dashboards and CSV export.
Figures are as filed on 12 September 2026; live dashboards may differ.