
Data & Intelligence
Energy data for investors, policymakers and researchers.
Five live dashboards, one data catalogue and a methodology note. Free membership opens all of them; visitors see a working preview first.
- Data in RV Energy Dashboard 52
- CSV export On every dashboard, for members
The products
Five dashboards.
Every dashboard is built the same way: a named source, a stated licence and a refresh that runs as the source updates. Open any of them to see a live preview, then join free to open it in full.
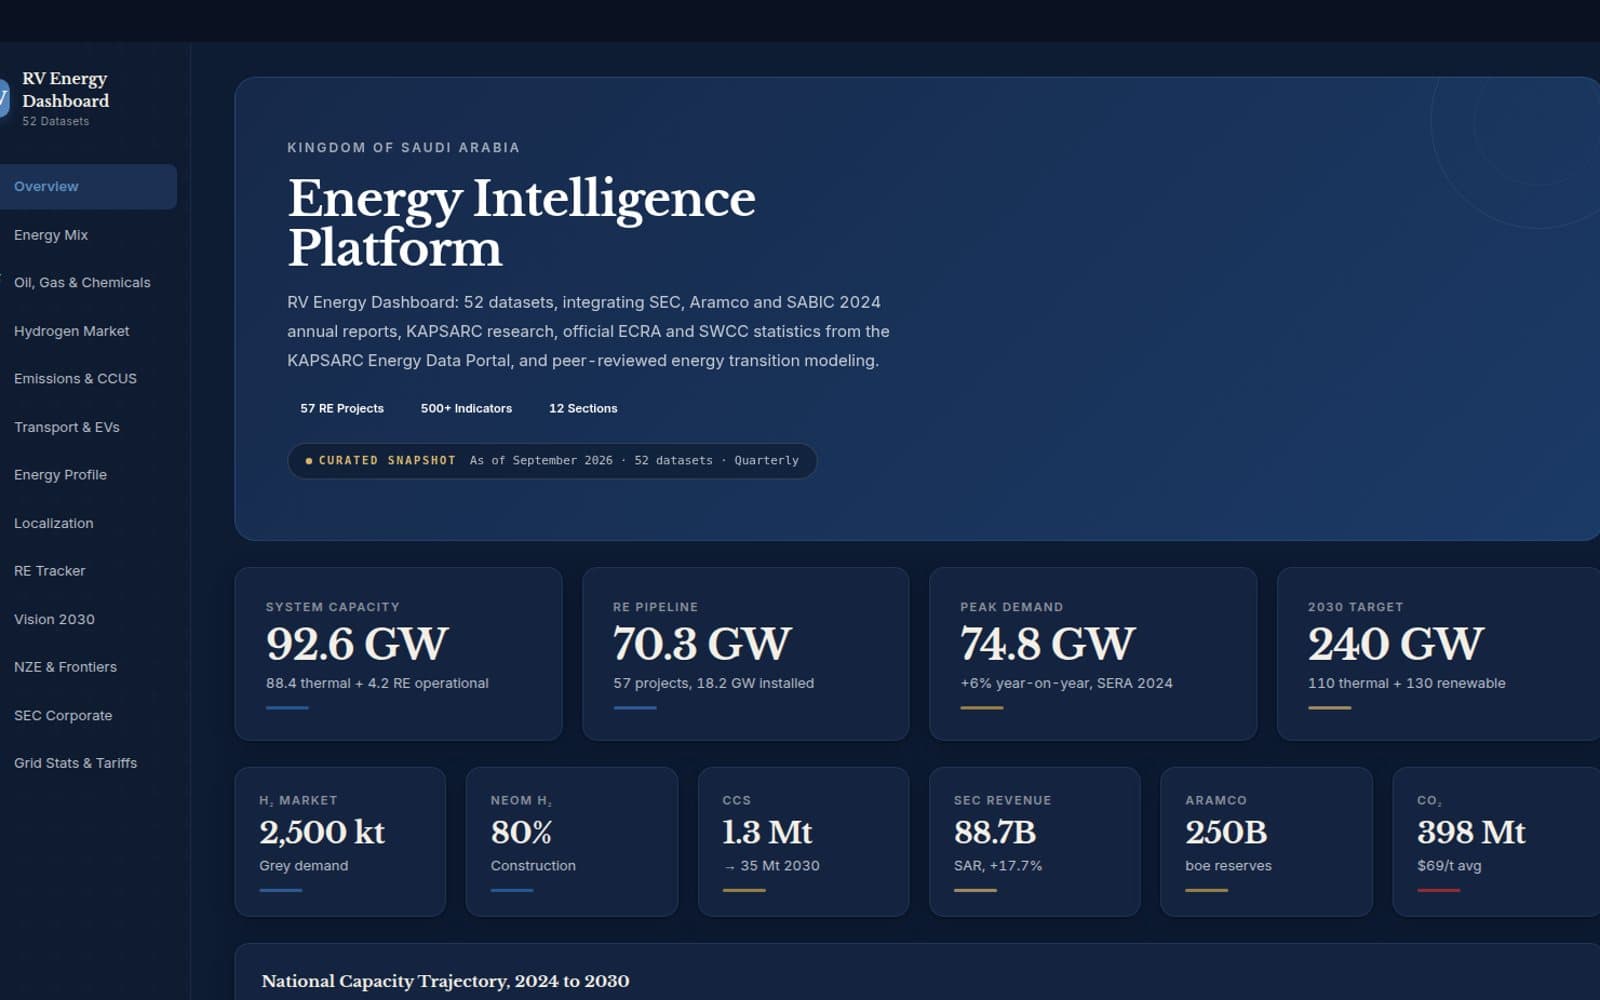
Tracker · Saudi Arabia
Saudi Renewables Tracker
Utility-scale and off-grid projects by technology, capacity and status, with the credit route for each.
Preview it, then open it free with membership →
Scorecard · Saudi Arabia
Saudi Energy Transition Scorecard
Renewables, thermal and grid build-out, oil and gas capacity, investment and emissions, live from the trackers and registers, with a crude displacement model priced at today's Brent.
Preview it, then open it free with membership →
Tracker · Saudi Arabia
Saudi Data Centre Load Tracker
Facilities, IT load and flagship projects today, with a 2030 scenario range.
Preview it, then open it free with membership →
Tracker · Worldwide
Global CCUS Tracker
Capture, transport and storage facilities worldwide: operating, under construction and planned, by status and region.
Preview it, then open it free with membership →
Dashboard · Saudi Arabia
RV Energy Dashboard
Thirteen sections covering Saudi power and grid statistics, hydrogen, emissions, transport and macro indicators, compiled in house.
Preview it, then open it free with membership →
What the dashboards track
Five live dashboards.
70 GW
Renewable capacity tracked, 58 projects
Source: KAPSARC Renewable Projects Tracker (CC BY-NC 4.0), cross-checked against NREP
50
CCUS facilities operating worldwide, 73 under construction
Source: IEA CCUS Projects Database (CC BY 4.0), April 2025
290.5 MW
Saudi data-centre load, 2024 baseline
Source: KAPSARC / ICAIRE paper and public announcements
52
Data series in RV Energy Dashboard
Source: RV Energy Dashboard model
Oil market
Crude oil benchmarks, updated daily.
Brent and WTI spot closes, the spread between them and the EIA short-term outlook, open to every visitor.
130.80 US$
Brent
Source: EIA daily spot via the KAPSARC portal · as of 2026-09-15
107.02 US$
WTI
Source: EIA daily spot via the KAPSARC portal · as of 2026-09-15
23.78 US$
Brent to WTI spread
Source: EIA daily spot via the KAPSARC portal · as of 2026-09-15
+38.78 (+42.1%)
Brent, 30-day change
Source: EIA daily spot via the KAPSARC portal · as of 2026-09-15
Brent and WTI, last 12 months
EIA forecast, WTI average, calendar 2027: $70.00
Official daily spot prices from the U.S. Energy Information Administration, mirrored each evening through the KAPSARC Energy Data Portal. Prices are the previous business day's close, not a live exchange feed.
Oil balance model
Where the price goes when electrons and molecules move.
A transparent world balance: the EIA outlook is the anchor, and nine levers move demand, supply and inventories, which move the price around that anchor. Choose a scenario or set the levers yourself; every input is listed with its source and whether it is live.
Brent today
$131
2026-09-15
Average, next 12 months
$104
Brent, model
Month 24
$82
Brent, model
Month 36
$82
Brent, model
Demand at the end
105.6
mb/d
Supply at the end
111.9
mb/d
Inventories vs outlook
0
million barrels
Electric-car share at the end
38%
trend 38%
Brent: last 12 months observed, then the model path with its band
World balance by quarter, mb/d
Method: each month the levers change demand and supply against the outlook's balance; the difference accumulates as inventories; the price moves around the outlook path in proportion to that inventory deviation, capped at 60%, and feeds back into demand at once and into US supply six months later. The band re-runs the same path at 0.6 and 1.6 times the inventory sensitivity. Full equations and defaults are in the method note.
Data sources and licences
Sources and licences.
- KAPSARC Renewable Projects Tracker
- CC BY-NC 4.0Non-commercial reuse, attribution required.
- IEA CCUS Projects Database
- CC BY 4.0Attribution required.
- Ministry of Energy
- Published tender dataCited, not redistributed.
- RV Energy Dashboard
- Compiled in houseKAPSARC-aligned methodology, 52 data series.
Used under each source's own licence terms.
Access model
Three ways to use this data.
- Free membership
- Every dashboard shows a working preview to visitors. Verify an email address or mobile number once, free, and the full dashboards, maps and CSV export open.
- CSV export
- On every dashboard, for members who have completed their profile.
- Licensed access, bulk data or scheduled delivery
- Scoped as an engagement — request access below.
How we compile
A stated methodology.
Each dashboard starts from a named public source, KAPSARC, the IEA or Ministry of Energy tender data, and adds our own compilation, cross-checks and review cadence. The methodology note covers what is observed, what is modelled, and how each dashboard is reviewed.

Coming soon
RV Plus and RV X.
Two paid tiers launching later, separate from free membership: RV Plus is the reading list with more content; RV X adds the data itself and direct access to the analysts. Register interest to be first to know.
- 01
Quarterly Saudi energy briefing
A summary of capacity, demand, tenders and policy, with the figures behind it.
- 02
Dataset release notes
What changed in each RV Intelligence and Energy Dashboard update, and why.
- 03
Early access to new dashboards
New products and sections before they are listed publicly.
- 04
Invitations to briefings
Technical and market briefings in Jeddah and online, with a written agenda.
Free membership is live today and stays free. RV Plus and RV X are upgrades, coming soon. See what RV Plus and RV X will include
Request access, or ask us to build a dataset.
Use the dashboards freely, or ask for licensed access, bulk delivery, or a dataset built to your scope.