Renewable power
Saudi solar and wind prices
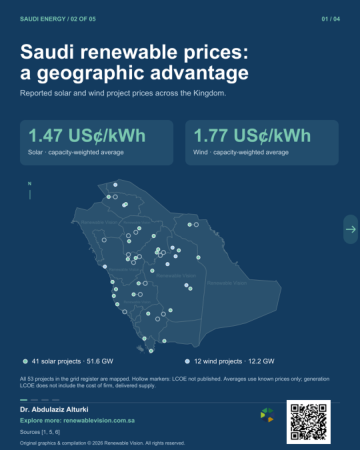
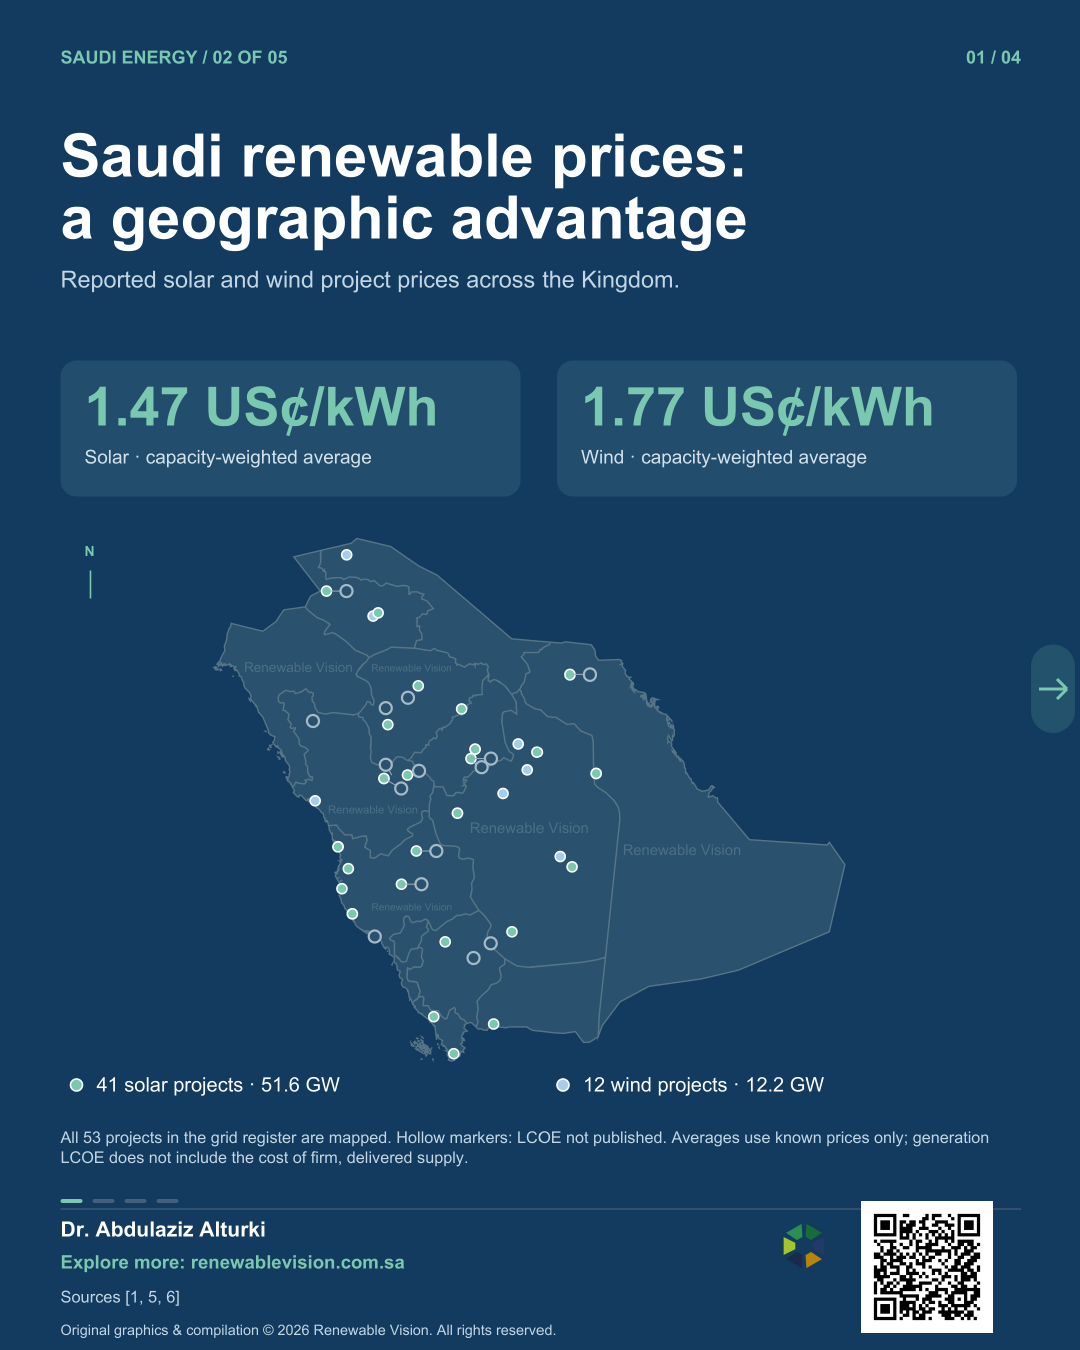
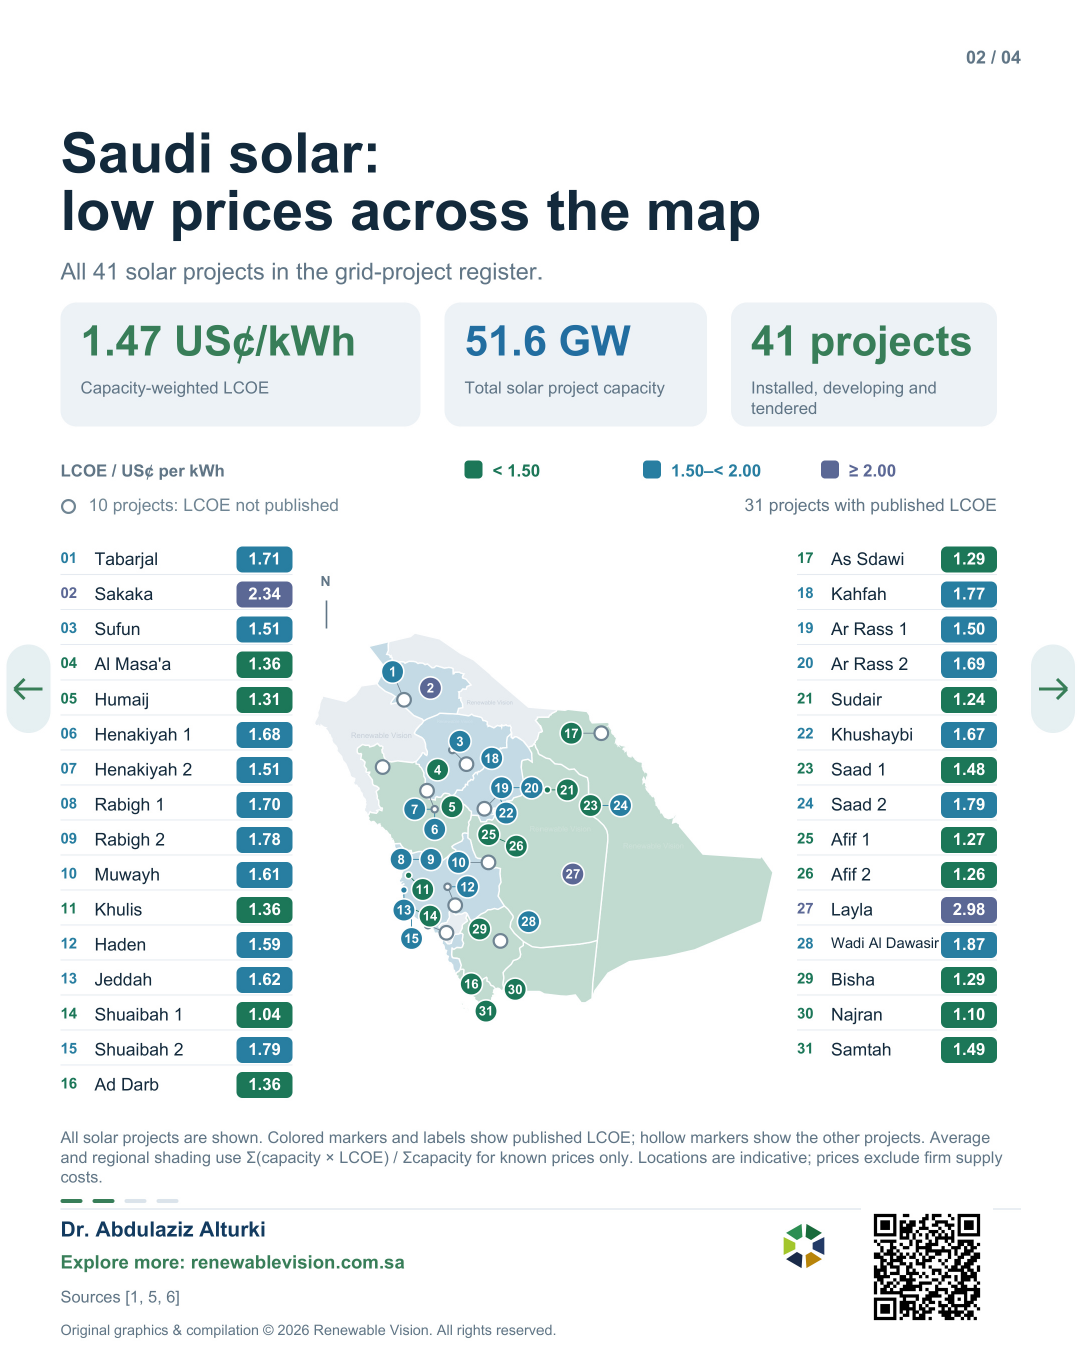
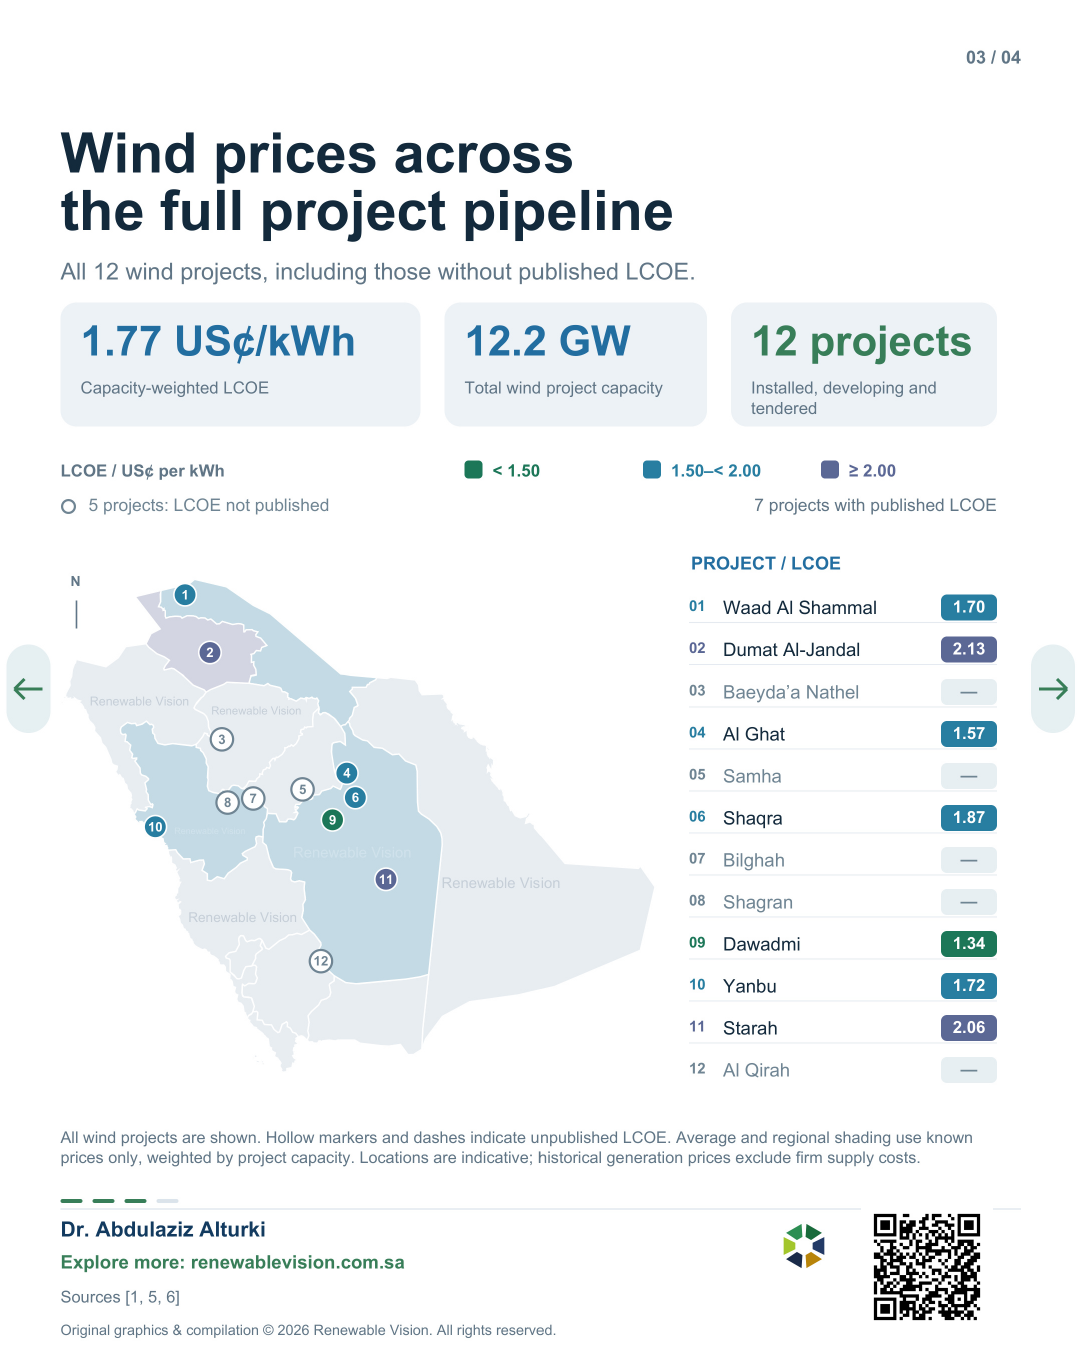
Plots the published price of every priced project in the Saudi grid register — 41 solar projects totalling 51.6 GW and 12 wind projects totalling 12.2 GW — with hollow markers for the 10 solar and five wind projects that carry no published price. The capacity-weighted averages are 1.47 US cents/kWh for solar and 1.77 US cents/kWh for wind, computed over priced capacity only, so they are generation prices at their own contract vintages rather than the cost of electricity delivered around the clock. Figures are as compiled on 12 September 2026.
- Compiled 12 September 2026
- 4 pages
What the report covers
Saudi Arabia's renewable price advantage extends across many projects and locations.
The maps cover the full grid-project register: 41 solar projects totaling 51.6 GW and 12 wind projects totaling 12.2 GW, across installed, development and tender stages.
Colored markers show published LCOE; hollow markers show the 10 solar and five wind projects without published prices. The capacity-weighted averages are 1.47 US cents/kWh for solar and 1.77 US cents/kWh for wind, calculated from known prices only. Larger projects contribute more to each average.
For industrial planning, generation price is the starting point. The cost of delivering electricity when it is needed also depends on the supply arrangement, grid services and any storage or firming requirements.
Contract vintages and source dates are retained, so these figures should not be treated as a uniform price for continuous power supply.
Where can this renewable generation advantage create the greatest industrial value?
Next: Saudi battery storage, from the operating fleet to procurement.
What the figures mean
Quoted from the report's own notes on scope and definitions, in the words it published them in.
- 70 GW renewable project coverage: rounded from 63.813 GW in the grid-project register + 4.49 GW across NGHC, The Red Sea and AMAALA + 2 GW of separately reported ENOWA tenders. This combines different project stages and source AC/DC conventions; it is not operating capacity or a new official national total. The two ENOWA reports date to July 2024; current awards and final grid interfaces are unverified.
- 44.3 GWh battery projects: 18 GWh energized grid capacity + 4 GWh of further Saudi Energy awarded projects + 8 GWh under SPPC Group 1 agreements + 12 GWh of Group 2 procurement + 2.327 GWh in dedicated systems = 44.327 GWh. It is not an all-operating fleet total. Power in GW and energy in GWh are separate quantities.
- Dedicated battery ratings: Red Sea 1.227 GWh + AMAALA 0.700 GWh + NGHC 0.400 GWh. EDF's 0.770 GWh AMAALA figure and Sungrow's 0.600 GWh DC NGHC quantity have different reporting bases and are not additional projects.
- LCOE map coverage: all 41 registered solar projects (51.613 GW) and 12 wind projects (12.200 GW) are represented. Hollow markers show 10 solar and five wind projects without published prices. This is the full grid-project register; dedicated off-grid projects are covered in the separate dedicated-systems PDF.
- Renewable price averages: sum of project capacity multiplied by its reported price, divided by total priced capacity. Solar: 31 priced projects, 36.513 GW, approximately 1.47 US cents/kWh. Wind: seven priced projects, 6.700 GW, approximately 1.77 US cents/kWh. Unpriced projects are excluded from the averages but remain on the maps. These are capacity-weighted means, not medians or generation-weighted averages; reported contract vintages are retained.
- Battery costs: the approximately USD 120/kWh and USD 123/kWh Tabuk and Hail figures are capital-cost comparisons using the cited procurement energy basis. The 6.5 US cents/kWh storage benchmark is an Ember modeled LCOS excluding charging energy, not a Saudi auction discharge tariff.
- Locations: points are project or named-area proxies where surveyed plant coordinates are unavailable. The ENOWA tender locations are indicative named areas. They do not establish final engineering footprints.
Sources
The PDF carries its own source page as well.
- KAPSARC
- SPPC / Principal Buyer
- SPPC / Principal Buyer
- SPPC / Principal Buyer — Renewable project register
- SPPC / Principal Buyer — Round 7: six projects, 5,300 MW
- SPPC / Principal Buyer — Round 7 qualified developers
- Saudi Energy — H1 2026 earnings release, p. 4
- Saudi Energy — H1 2025 results presentation, p. 8
- NR Electric — 2.5 GW storage cluster energized
Preview
3 of 4 pages shown
Get the report
Saudi solar and wind prices
The PDF and the data files are free for members. Membership takes a minute: verify an email address or a mobile number once, and the download opens along with the dashboards and CSV export.
Figures are as filed on 12 September 2026; live dashboards may differ.